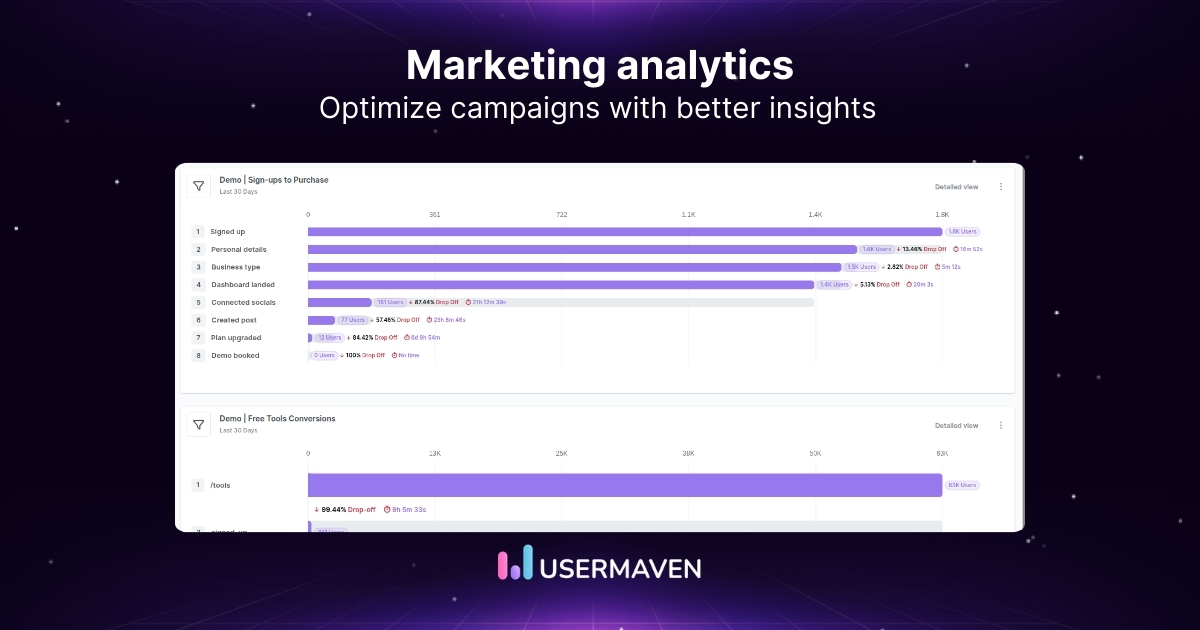
Marketing often looks clearer in strategy decks than it does in actual performance.
You can execute a flawless campaign on paper and still see a gap between the activity you launched and the conversion rate you expected.
Marketing analytics helps explain that gap. It connects activity to impact, so you can understand what your audience is responding to, where momentum is slowing, and what is actually influencing results.
In this guide, we’ll break down the metrics that actually matter, different types of marketing analytics, and how to implement them in a way that leads to better decisions.
What is marketing analytics?
Marketing analytics is the practice of measuring what your marketing is actually generating. Not just traffic and clicks, but the actions that turn into qualified leads, trials, and revenue, so you can make better decisions based on real outcomes.
It applies across all channels, including website behavior, paid and organic traffic, email performance, and social media engagement.
Digital analytics helps you understand what happened across sessions, pages, and devices. Once you connect that data with CRM insights and product usage, it becomes far more useful, because you can clearly see which efforts are actually driving qualified demand.
Strong marketing analytics is built for cross-channel marketing. That usually comes down to three things:
- knowing what questions you need answered
- choosing metrics that align with those questions
- reviewing performance consistently and acting on what you find
Types of marketing data
Marketing data comes in two forms: online data and offline data. You need both to see the full story from first touch to revenue.
Online data is what happens on your site, in your campaigns, and inside your product. This is the foundation of digital marketing analytics because it shows acquisition, intent, and conversion behavior.
- Channel and campaign traffic
- Landing pages and on-site journeys
- Conversion events like signups, demo requests, and trial starts
- Product events that signal activation and intent
Offline data covers signals that aren’t captured on the website or in-app. It’s often where outcomes get confirmed for B2B growth marketing teams.
- CRM updates and deal notes
- Sales touchpoints like calls, meetings, and demos
- Event interactions and partner referrals
Importance of marketing analytics
Let’s look at how marketing analytics helps you make better marketing decisions and improve results.
- It tells you what is actually driving growth.
Strong digital marketing analytics connects campaigns to leads, pipeline, and revenue. This is where data analytics for marketing decisions becomes useful, because it shows you what is worth scaling, fixing, or cutting. - It makes marketing attribution more useful.
You can see which channels and touchpoints are influencing conversion, which helps you spend with more confidence and cut what is not working. - It helps SaaS marketing teams improve beyond acquisition.
Beyond signup, SaaS marketing analytics reveal activation, retention, and expansion opportunities that drive growth. - It gives you a clearer view of buyer awareness.
You can spot which pages, campaigns, and messages are creating early interest and which ones are moving buyers closer to action. - It makes lifecycle marketing more precise.
Instead of relying on assumptions, you can use behavior data to improve onboarding, nurture sequences, re-engagement, and upsell timing. - It gives market forecasting a stronger foundation.
When performance is tracked consistently over time, trends become easier to read, and future planning becomes more grounded.
[insight_growth]
Key marketing metrics you should track
Marketing analytics gets a lot easier when you know which numbers are actually worth watching.
Here are the key marketing metrics worth paying attention to.
Website metrics
Start with the website metrics that show how people arrive, move through your site, and respond to what they find.
- Users and sessions: Track how much traffic you are getting and whether that volume is growing, flat, or dropping.
- Traffic sources: See where visits come from so you can compare organic, direct, referral, social, and paid channels.
- Bounce rate or engagement rate: Understand whether visitors are actually interacting or leaving without taking action.
- Sessions per user: Measure how deeply people explore your site once they land.
- Average session duration: Use this to spot whether content and landing pages are holding attention.
- Top landing pages: Identify which entry points bring in the most visits and which ones deserve further optimization.
Related: How to check traffic on any site
Conversion metrics
Traffic tells you interest. Conversion metrics tell you whether that interest is turning into action.
- Conversion rate: Measure the percentage of visitors who complete a target action such as a signup, demo request, or purchase.
- Lead-to-customer rate: Track how well your funnel turns raw leads into paying customers.
- Cost per conversion: Compare how much you spend to generate each meaningful action.
- Trial-to-paid conversion rate: For SaaS, this is one of the clearest signals of whether your acquisition quality and onboarding are aligned.
- Funnel drop-off rate: See where users lose momentum across key stages so you know where optimization matters most.
- Marketing qualified leads (MQLs): Track how many leads meet your quality threshold, not just your volume target.
Email marketing metrics
Email performance should tell you more than whether a campaign was sent. It should show whether people noticed it, engaged with it, and acted on it.
- Open rate: Use it as a directional signal for subject line relevance and audience fit.
- Click-through rate: Measure whether the message and call to action were strong enough to earn engagement.
- Click-to-open rate: Compare clicks against opens to understand how effective the content was after the email was opened.
- Unsubscribe rate: Watch for signs that content frequency, targeting, or message quality is off.
- Email conversion rate: Track how many recipients took the intended next step after clicking through.
- List growth rate: Measure whether your email audience is growing in a healthy and sustainable way.
Social media metrics
Social metrics should help you see whether your content is earning attention and moving people toward your site or product.
- Reach and impressions: Track how widely your content is being seen across platforms.
- Engagement rate: Measure likes, comments, shares, and saves relative to audience size or impressions.
- Referral traffic from social: See how much site traffic your social channels are actually generating.
- Social conversion rate: Go beyond engagement and track whether social traffic converts once it lands.
- Follower growth rate: Use this to measure audience momentum over time, not just total follower count.
- Content performance by format: Compare posts, carousels, videos, and other formats to see what earns the strongest response.
Paid advertising metrics
Paid channels move fast, which is why your paid search analytics needs to stay tied to both efficiency and business outcomes. This is also where performance marketing attribution becomes critical, because spend only makes sense when you can connect it to real return.
- Cost per click (CPC): Track how much you pay for each visit from paid campaigns.
- Click-through rate (CTR): Measure how well your ad creative and targeting are pulling attention.
- Cost per lead (CPL): Understand how much you are paying to generate each qualified lead.
- Return on ad spend (ROAS): Compare revenue generated against ad spend to judge efficiency.
- Customer acquisition cost (CAC): Measure what it actually costs to win a new customer from paid efforts.
- Attribution by campaign or channel: Use multi-channel attribution to see which ads assist, influence, or close conversions across the customer journey.
Retention metrics
Acquisition gets the attention, but retention tells you whether your marketing is bringing in the right customers in the first place.
- Customer retention rate: Track how many customers stay over a set period.
- Churn rate: Measure how quickly customers drop off so you can spot issues in fit, onboarding, or lifecycle marketing.
- Repeat purchase rate: For ecommerce or repeat-use products, this shows whether customers come back again.
- Customer lifetime value (CLV): Understand how much revenue a customer generates over time.
- Expansion revenue: Track how much growth comes from upgrades, add-ons, or account expansion.
- Feature adoption after acquisition: Connects marketing performance to long-term customer quality, not just initial sign-up or conversion.
6 different types of marketing analytics
Not all marketing analytics do the same job. Each type helps you answer a different question, from how people find you to what they do after they sign up.
1. Website analytics
Website analytics shows how people enter your funnel, what they pay attention to, and where they leave. It is one of the fastest ways to spot friction in messaging, page structure, and conversion paths.
This is also where you start making sense of different types of marketing funnels. You can see which landing pages bring intent, which traffic sources bounce, and which journeys actually move toward signup, demo, or purchase.
For a full-stack marketer, website analytics is often the first layer of truth. It tells you whether your acquisition engine is bringing in the right people and whether your site is helping them move forward.
2. Product analytics
Product analytics shows what happens after a user signs up or starts using your product. It helps you connect marketing performance to activation, engagement, and long-term value.
This matters because high-quality acquisition does not stop at the signup. In SaaS, you need to know whether the users marketing brings in actually reach meaningful product milestones.
It also makes retention marketing more grounded. Instead of only measuring lead volume, you can see which channels and campaigns bring users who stay, return, and convert over time.
3. Behavioral analytics
Behavioral analytics shows how people actually move through your funnel. It is built around tracking user behavior across pages, journeys, and key actions.
That makes it easier to see where intent is strong, where users hesitate, and where they drop before converting. You get more than activity. You get context.
It also makes customer segmentation more useful. Instead of grouping users only by source, you can segment them by behavior and see which patterns lead to action.
Over time, that creates a stronger base for predictive behavioral analytics. When you can spot repeat behavior patterns early, you can make better decisions before performance slips.
Also read: Predictive vs. prescriptive analytics
4. Social media analytics
Social media analytics shows whether your content is getting attention that actually leads somewhere. It helps you analyze content performance beyond impressions, so you can measure engagement, traffic quality, and social’s contribution to downstream action.
It also shows which messages connect with different audience groups and which formats are worth repeating. That gives you a stronger basis for shaping content around actual responses.
5. Campaign analytics
Campaign analytics is about measuring the performance of specific marketing efforts in context. It tells you what happened during a launch, a promotion, or a cross-channel push, and whether the outcome justified the effort.
This is one of the most useful views for optimizing campaigns. You can compare message, timing, audience, and channel mix to see what actually moved the needle and what just created activity.
It also keeps teams honest. A campaign can look busy on the surface and still underperform when you map it to conversions, pipeline, or revenue.
6. Performance marketing analytics
Performance marketing analytics focuses on paid channels where speed, cost, and return matter every day. It tracks spend against outcomes so teams can make decisions without waiting for a month-end recap.
This is where ad performance metrics become critical. You look at CPC, cost per acquisition (CPA), ROAS, and conversion efficiency to understand what is scalable, especially because returns to advertising can vary widely across firms and campaigns.
More importantly, it gives you a clear path to improve ad performance. When paid ads analytics is tied to attribution and downstream quality, you can stop optimizing for cheap clicks and start optimizing for actual results.
[quiz_marketing_skills]
A simple marketing analytics framework
Here’s a practical marketing analytics process you can follow to bring more structure to how you measure and optimize performance.
1. Start with a clear business question
Good analysis starts before the data does. You need to know what you are trying to understand, improve, or prove.
That could be a question about lead quality, campaign efficiency, buyer awareness, or why one stage of the funnel keeps underperforming. If the question is vague, the analysis usually is too.
2. Choose the metrics that match the question
Once the question is clear, the next step is choosing the numbers that can answer it. This is where a lot of teams go wrong by tracking too much or tracking the wrong thing.
A useful metric should help you make a decision. For example:
- traffic sources for acquisition quality
- conversion rate for funnel efficiency
- customer acquisition cost for spend control
- retention or activation rate for long-term value
3. Pull data from the right sources
Marketing data rarely lives in one place. Website activity, CRM records, campaign reporting, and product usage all give you different parts of the picture.
A structured approach brings those inputs together so you can connect acquisition to conversion, and conversion to retention. That is where analytics in digital marketing starts becoming more actionable.
4. Analyze patterns and find what is actually driving results
This is the step where raw numbers turn into something useful. You are looking for trends, drop-offs, channel differences, and behavior patterns that explain performance.
In practice, that often means asking questions like:
- Which channels bring qualified leads, not just visits?
- Where are users dropping out of the funnel?
- Which campaigns influence conversion but do not get last-click credit?
It is also the step that creates a foundation for predictive marketing analytics. Once you can consistently spot patterns in conversion, retention, and campaign performance, forecasting gets a lot more grounded.
5. Act on the insight and keep measuring
Analytics is only useful when it changes something. Once you find the signal, the next step is to adjust the campaign, fix the funnel, refine targeting, or improve messaging.
Then you measure again. That is what makes marketing analytics a process instead of a one-time report. It should help you make better decisions every round, not just explain the last one.
Examples of marketing analytics use cases
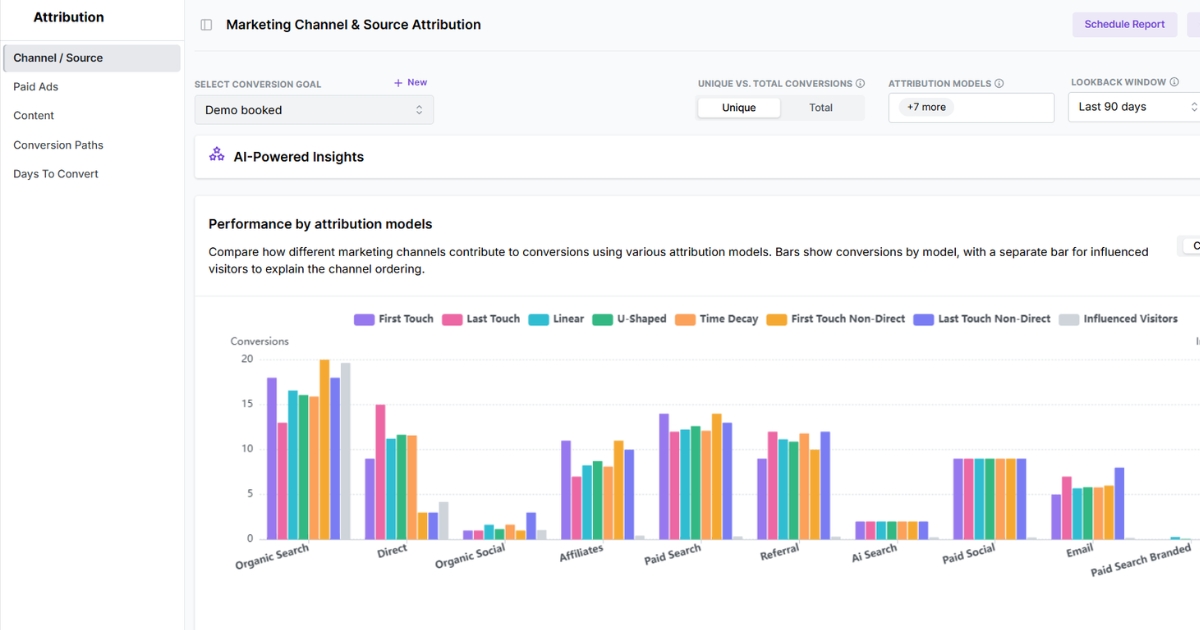
Marketing analytics gets more useful when you apply it to real decisions, not just reporting. Here are some of the most common ways teams use it.
- Campaign performance analysis:
Compare channels, messages, and offers to see which campaigns are driving qualified traffic, conversions, and revenue instead of just activity. - Funnel optimization:
Find where users drop off between first visit, signup, activation, and purchase so you can fix the steps that are slowing growth. - Audience segmentation:
Break users into groups based on source, behavior, intent, or lifecycle stage so you can tailor messaging and improve relevance. - AI-driven attribution:
Automatically weighs every touchpoint’s contribution across the journey, revealing what truly drives conversions beyond the last click. - Budget allocation:
Use performance data to put more budget into channels and campaigns that are producing results, and pull back where returns are weak.
Trends in marketing analytics
Marketing analytics is changing fast, mostly because the old ways of tracking people are getting weaker, and the pressure to prove impact is getting higher.
Here are the shifts shaping how teams measure marketing now:
- Third-party cookies matter less, so first-party data matters more.
As browsers continue limiting cross-site tracking, marketing teams are relying more on first-party data, server-side tracking, and cleaner owned data strategies to stay ahead. - Personalization is getting harder to fake and more important to get right.
Customers expect more relevant experiences, but not in a creepy, over-targeted way. That is pushing teams to use better segmentation, lifecycle context, and product or CRM data instead of broad assumptions. - Data-driven marketing is becoming the default, not the differentiator.
The question is no longer whether teams should use data. It is whether they can turn scattered reporting into decisions about messaging, channels, spend, and growth quickly enough to matter. - AI is moving from reporting support to measurement support.
One of the biggest shifts now is AI helping with attribution, incrementality, media mix analysis, and faster interpretation of performance data. In other words, analytics is starting to spend less time describing results and more time helping teams decide what to do next. - Privacy-first measurement is becoming part of the job.
Consent mode, updated tag behavior, and stricter expectations around user choice are pushing teams to build analytics setups that balance insight with compliance. The better setups now are the ones that can still measure performance while adapting to a privacy-by-design ecosystem.
Common challenges in marketing analytics (and how to fix them)
Marketing analytics sounds straightforward until the data starts disagreeing, the funnel gets messy, or every team reports something different.
Here are some of the most common problems and how to deal with them:
- Too much data, not enough clarity.
A lot of teams track everything and still struggle to answer simple questions. The fix is to start with a clear goal, then choose the metrics that actually help you make a decision. - Poor data quality.
Broken events, duplicate conversions, and inconsistent naming can quietly ruin reporting. Clean tracking plans, regular audits, and shared naming rules usually fix more than another dashboard ever will. - Disconnected tools and siloed data:
Website analytics, CRM data, ad platforms, and product data often live in separate systems. Bringing the right sources together gives you a clearer view of performance from first touch to revenue. - Vanity metrics getting too much attention.
Traffic, impressions, and clicks can look good without creating real business impact, which is why teams need marketing metrics that show the full picture. The fix is to tie reporting back to outcomes like qualified leads, activation, retention, and revenue. - Weak visibility into the funnel.
Teams often know traffic is coming in, but cannot see where the momentum breaks. Mapping the funnel properly and tracking each stage makes it easier to spot leaks and fix them faster. - Overcomplicated reporting.
Reports become hard to use when they are built for everyone and are useful for no one. Keep reporting focused on the few numbers that explain performance and support better decisions.
Best marketing analytics tools out there
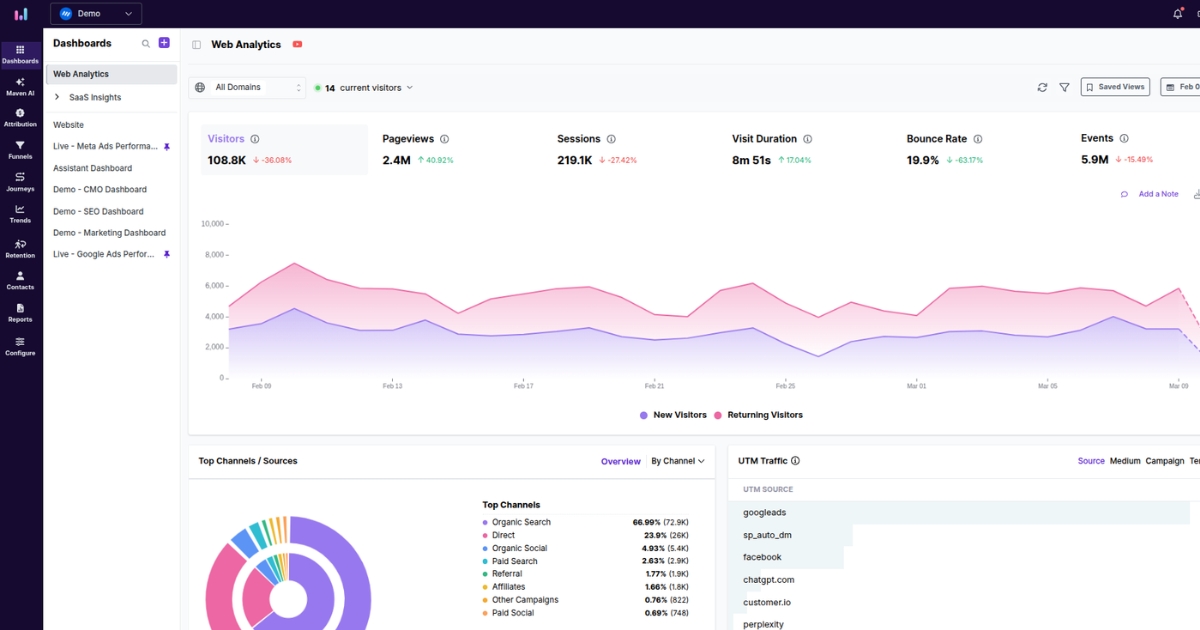
The right tool depends on what you need to measure, how deep you need to go, and how connected you want your reporting to be.
Here are some of the most widely used marketing analytics tools:
1. Usermaven: AI-powered analytics and attribution tool built for teams that want a clearer view of marketing performance without a complicated setup. It helps connect website activity, user journeys, attribution, and campaign impact, so marketing decisions are easier to make and easier to trust.
2. Google Analytics: Widely used for tracking website traffic, user behavior, and conversion activity. It is useful for understanding how people find your site and what they do once they get there.
3. Mixpanel: Built for event-based tracking and product analytics. It is especially useful when you want to measure user actions, funnels, and engagement in more detail.
4. Looker: Business intelligence platform for teams that need more advanced reporting and data exploration. It works well when you want to combine multiple data sources into one reporting layer.
5. Databox: Helps teams pull metrics from different tools into one dashboard. It is a practical option for tracking performance across channels without building reports from scratch.
6. Matomo: Privacy-focused analytics platform that gives teams more control over their data. It is often used by businesses that want website analytics without relying fully on third-party platforms.
7. Plausible: Lightweight web analytics tool with a simple interface and privacy-friendly approach. It works well for teams that want straightforward traffic and website performance reporting without extra complexity.
Wrapping up
Marketing analytics is ultimately about measuring whether the time and money you invest in growth actually pay off. You need to know which campaigns draw in the right audience and how those visitors behave once they arrive at your site.
Getting this level of clarity shouldn’t be a struggle. A marketing attribution platform like Usermaven connects your marketing efforts directly to in-app behavior, giving you a single, honest view of your growth without the data silos or technical headaches.
Want to stop piecing together fragmented reports and finally see exactly which campaigns are driving real growth?
Start a free trial or book a demo today to see your entire marketing impact in one clear, unified view with Usermaven.
Leave a Reply