Category: Data analysis
-
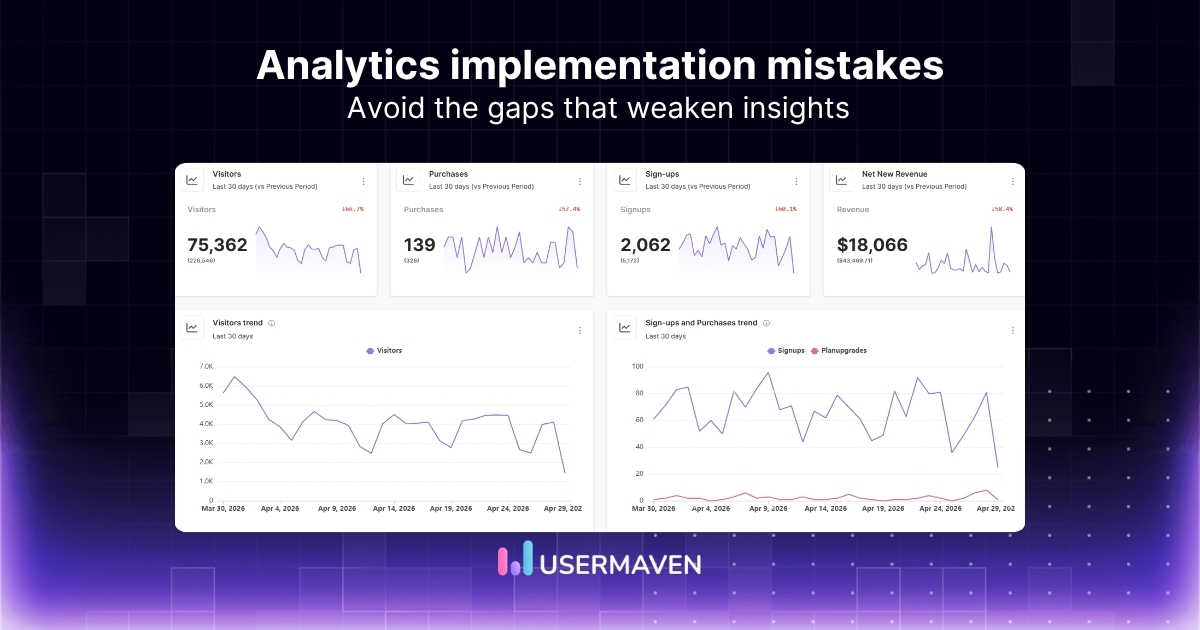
The biggest analytics implementation mistakes companies make
Every company wants better data. But better data does not come from adding another dashboard, tracking every possible event, or giving the data team a long list of reports to build. That is where many analytics implementation projects start to go wrong. The tool may be powerful. The data may be there. The team may…
-
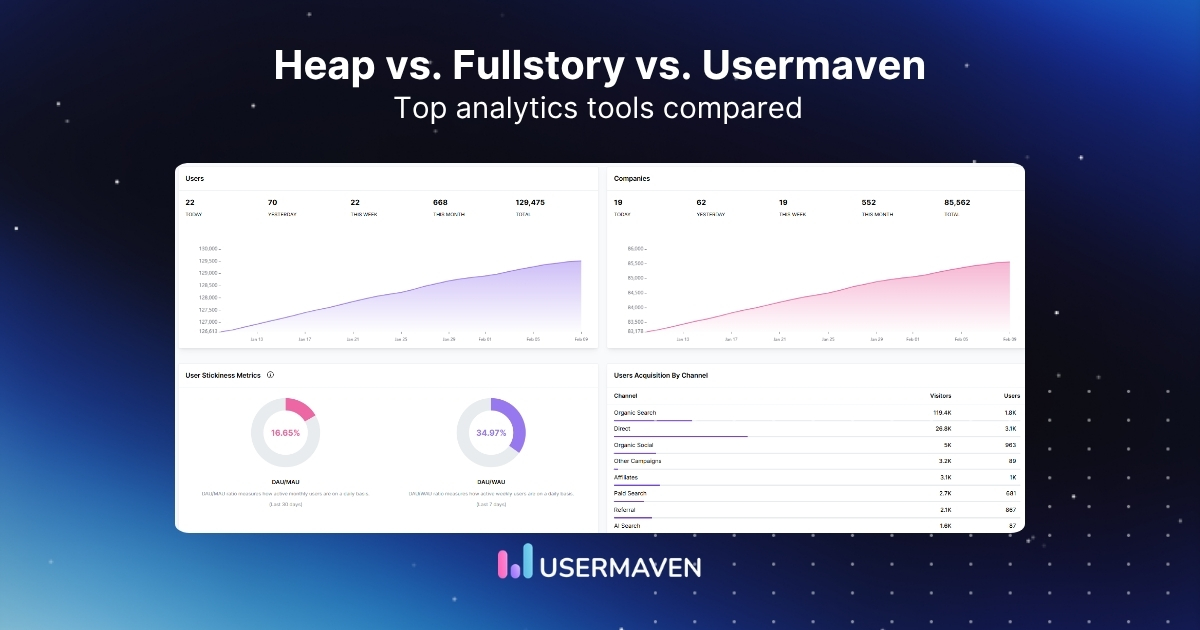
Heap vs. Fullstory vs. Usermaven: Which tool stands out?
User behavior can tell you a lot, but only if the data is easy to trust, explore, and act on. That is why a Heap vs. Fullstory vs. Usermaven comparison is worth looking at closely. They all help teams understand what users are doing, but they differ in how much context they give around the…
-
![[2026 updated] Usermaven vs. Google Analytics made simple](https://staging-blog.usermaven.com/wp-content/uploads/2024/12/Usermaven-vs.-Google-Analytics.jpg)
[2026 updated] Usermaven vs. Google Analytics made simple
Analytics should make the next decision easier. But when reports feel hard to read, slow to act on, or difficult to trust, teams start looking beyond the default option. That is where Usermaven vs. Google Analytics becomes a useful comparison. Both help you understand website performance, but they differ in how they handle tracking, privacy,…
-
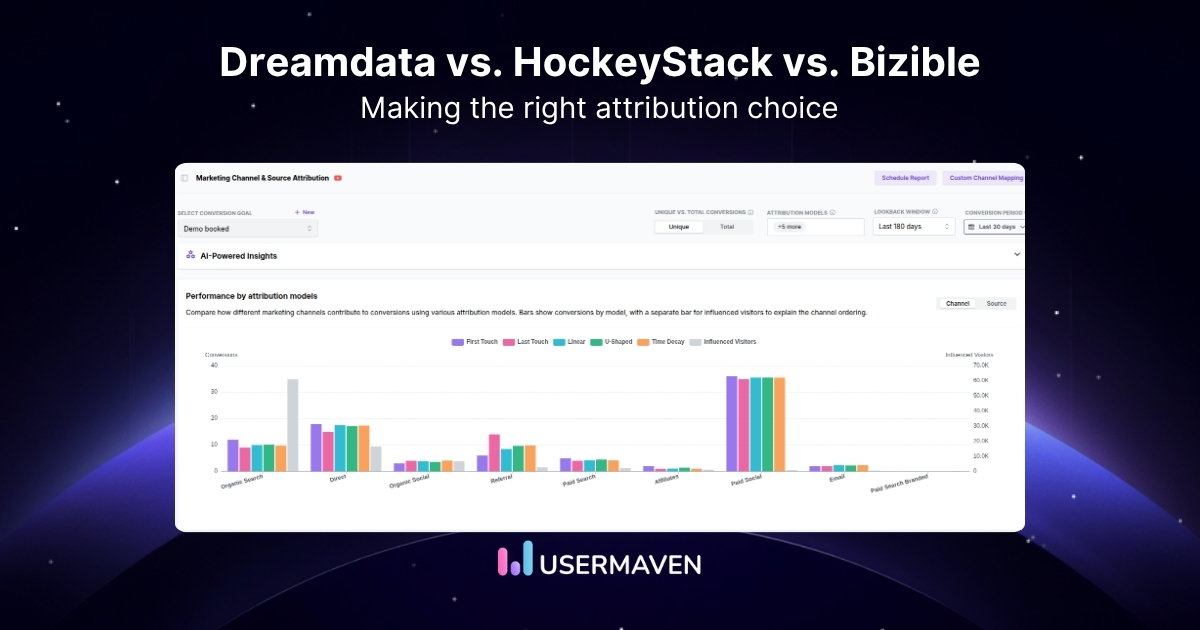
Dreamdata vs. HockeyStack vs. Bizible: Choose your B2B stack
Marketing attribution is easy to talk about and much harder to get right. Most teams already have data coming in from different channels and campaign touchpoints. The problem is figuring out how those interactions connect to pipeline and revenue in a way you can actually trust. That is what makes Dreamdata vs. HockeyStack vs. Bizible…
-
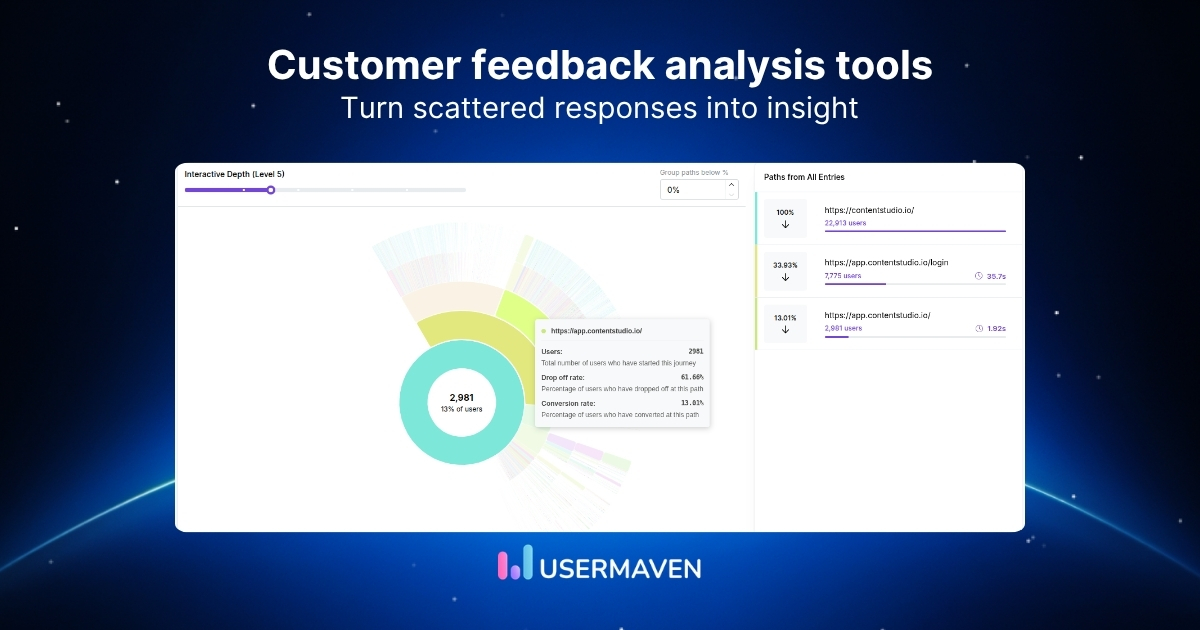
8 best AI-powered customer feedback analysis tools for 2026
Customer feedback has never been more abundant, or more difficult to interpret. Reviews, surveys, support tickets, in-app comments, social mentions, and community posts generate a constant stream of customer language. While collection has become automated and scalable, interpretation remains the bottleneck. By 2026, organizations are no longer asking whether they collect enough feedback. The real…
-
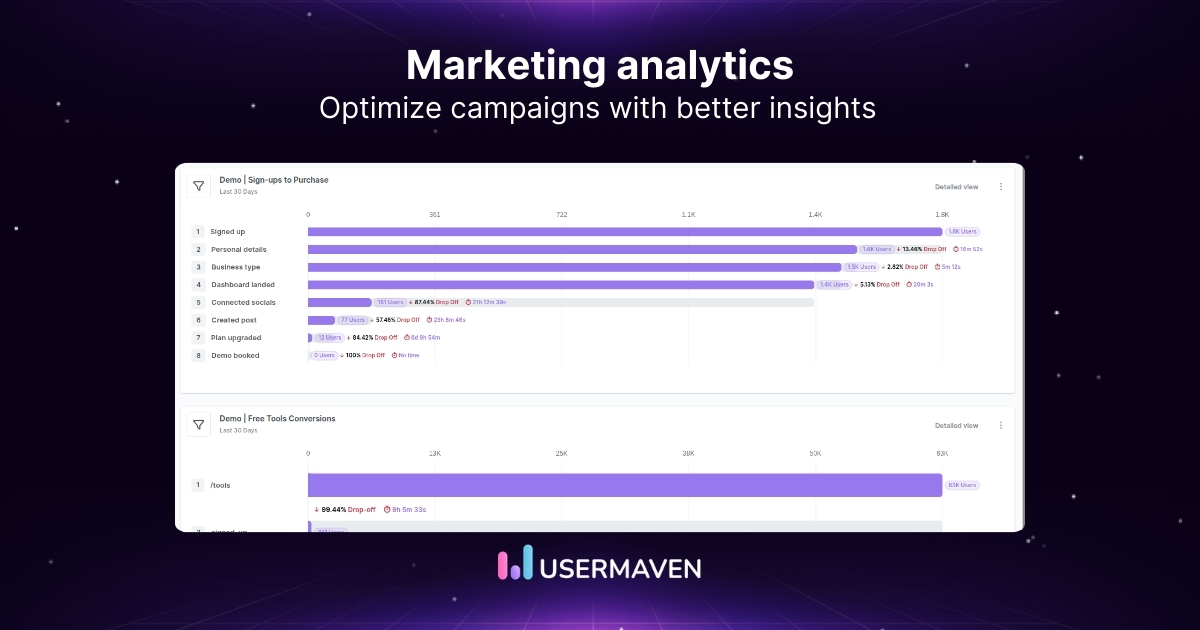
What is marketing analytics? Types, metrics & tools
Marketing often looks clearer in strategy decks than it does in actual performance. You can execute a flawless campaign on paper and still see a gap between the activity you launched and the conversion rate you expected. Marketing analytics helps explain that gap. It connects activity to impact, so you can understand what your audience…
-
![User behavior tracking: What it is, how it works [+best tools]](https://staging-blog.usermaven.com/wp-content/uploads/2025/01/User-behavior-tracking.jpg)
User behavior tracking: What it is, how it works [+best tools]
More than 70% of website visitors leave without taking any action. The real challenge is understanding what users actually do once they arrive. User behavior tracking helps marketing, product, and growth teams see how people interact with their websites or apps. Instead of guessing why users drop off, teams can analyze real actions such as…
-
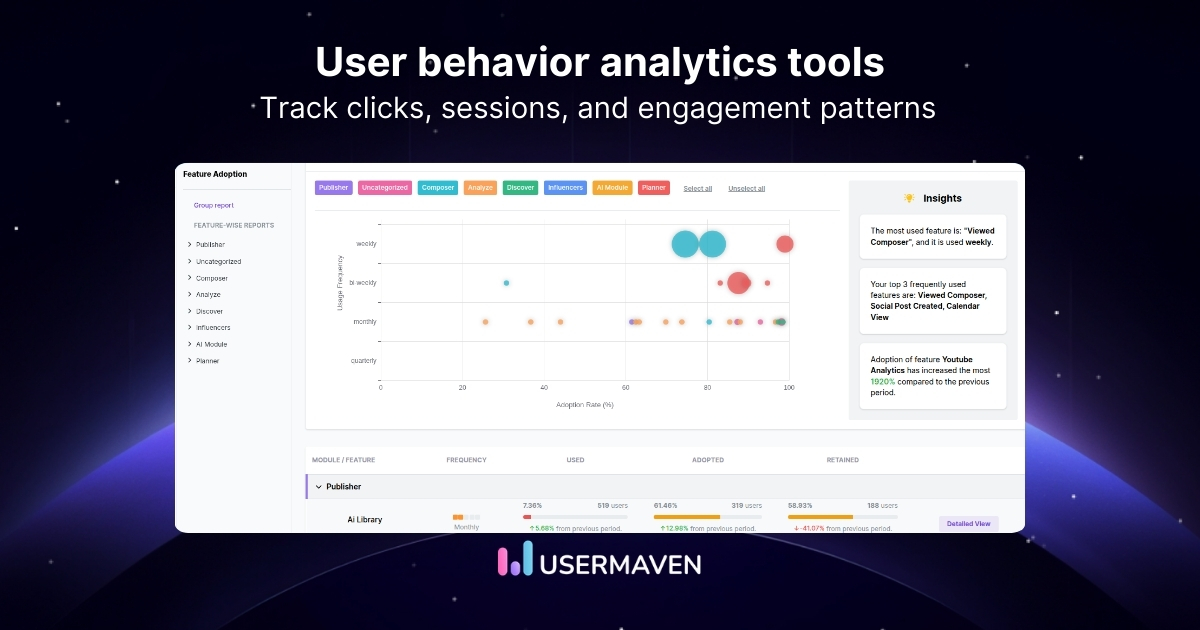
Top 20 user behavior analytics tools for websites & SaaS
What if you could watch how every visitor uses your website? User behavior analytics tools make that possible. They record interactions like clicks, scroll depth, and navigation paths so teams can understand how users move through pages, forms, and product features. These insights help identify friction points, improve onboarding flows, and optimize conversion paths across…
-
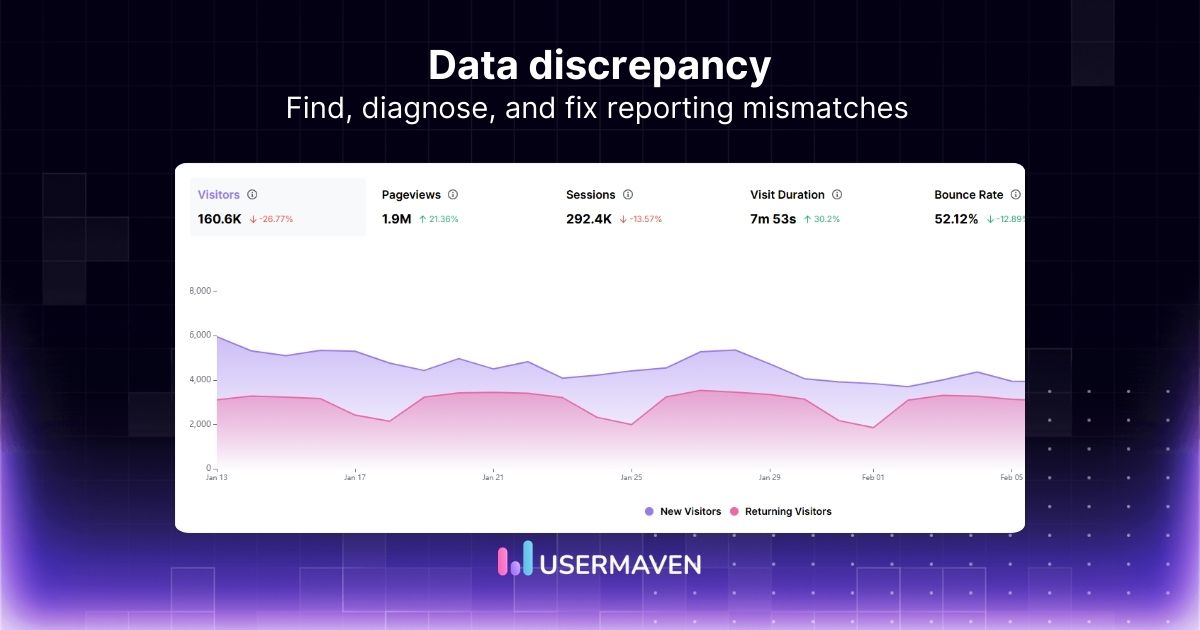
What is data discrepancy? Causes, types & how to fix it
Numbers rarely lie. But sometimes they don’t agree. You open two analytics tools expecting the same report. One shows 10,000 visits. The other shows 8,700. Suddenly, you are left wondering which number is correct. This situation is known as a data discrepancy. A data discrepancy happens when different systems report different values for the same…
-
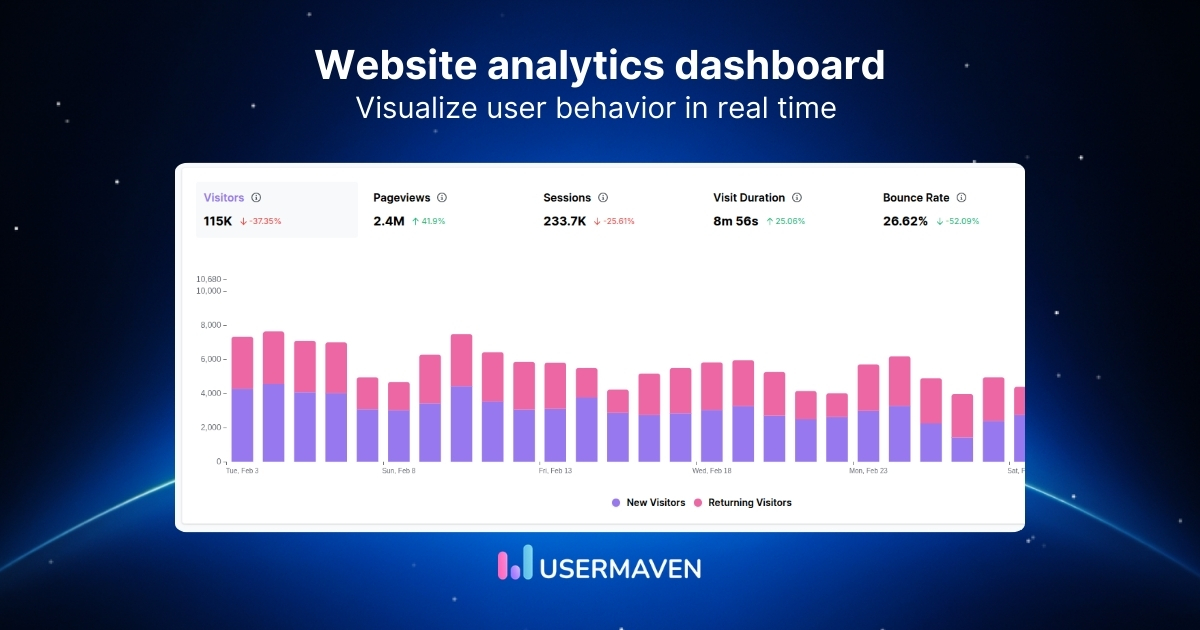
Web analytics dashboard: Metrics, types & examples
You’re not just building a dashboard for reporting. You’re building it so someone can open it for 30 seconds and know what to pay attention to. A solid web analytics dashboard answers three questions fast: what changed, where it came from, and what it did to conversions. Everything else is a drill-down. It should feel…