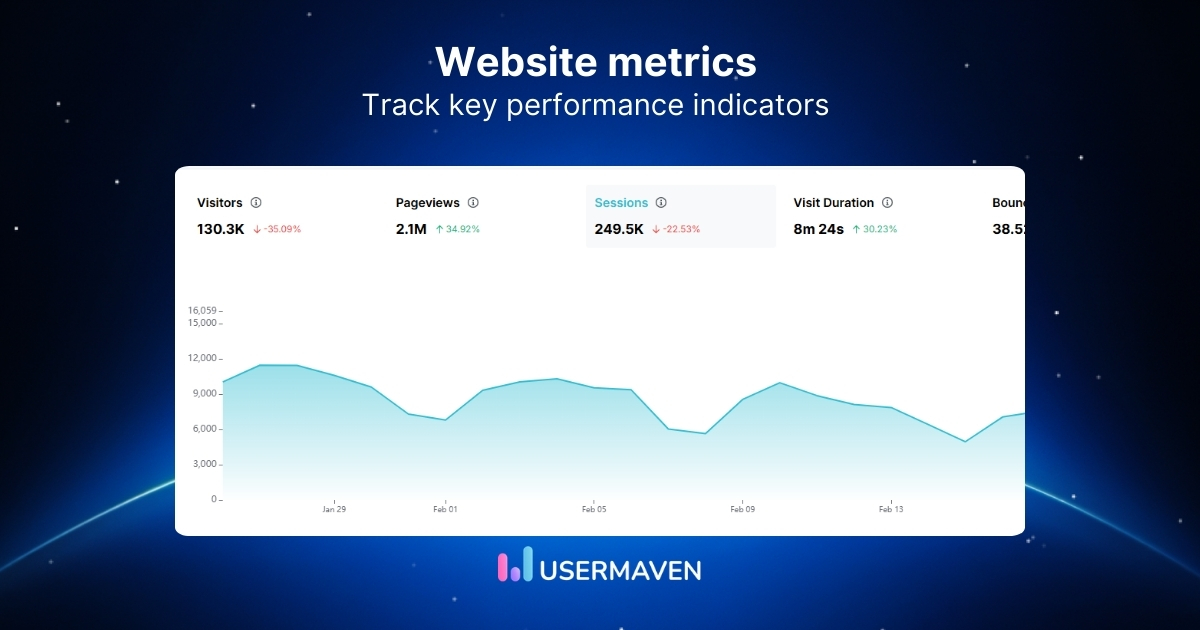
Website metrics tell you what’s working. They also show you what isn’t.
That matters because most conversion problems are invisible until you measure them.
With the right website analytics in place, you can see the full story: where people come from, what they do on your site, and which pages move them forward or cause a drop off.
In this guide, you’ll get the website metrics that matter most, so you can quickly find the numbers you need and act on them.
What are website metrics and why do they matter?
Website metrics are the specific numbers you track to measure your site’s effectiveness. They turn your website analytics strategy into something you can evaluate, improve, and repeat.
Instead of relying on assumptions, you use metrics to judge performance against a goal. That goal might be signups, demo requests, purchases, or qualified leads.
Here is why tracking the right website analytics metrics is essential:
- Spot what’s working. See which pages, channels, and campaigns actually drive results.
- Fix what’s broken. Identify friction points where visitors drop off or disengage.
- Connect activity to revenue. Link site behavior to signups, demos, and orders.
- Prioritize what matters. Focus on conversion and retention, and not just vanity metrics.
- Prove marketing ROI. Show clear cause and effect between campaigns and outcomes.
This is where the advantages of web analytics become clear for marketing teams, product managers, and ecommerce leaders.
Next, let’s explore the key website metrics worth tracking and what each one tells you.
[web_analytics]
1. Unique visitors
Unique visitors show how many individual people visit your site during a set time window.
Why it matters:
- This number reflects your true audience reach and shows how well your brand and campaigns attract new attention.
What to do if it’s high/low: If it is growing, your top-of-funnel efforts are working. If it stalls, test new channels, content angles, or offers to reach new groups.
2. Total visits or sessions
Total visits or sessions count every visit, including repeat visits from the same person.
Why it matters:
- When sessions grow faster than unique visitors, it signals that people return often, and your content gives them reasons to come back.
What to do if it’s high/low: If you see many visitors but few repeat sessions, focus on retention plays like remarketing, email flows, or more helpful on-site content.
3. Traffic by source
Traffic by source breaks visitors into channels such as direct, organic search, paid campaigns, referral tracking, and email.
Why it matters:
- This is the heart of lead source tracking because it shows where your best visitors come from, not just the most visitors.
What to do if it’s high/low: If one paid campaign brings traffic but no signups, while organic search drives high-value trials, shift your spend and content efforts toward what already works and fix any UTM mistakes that blur the picture.
Related: How to check traffic on any site like a pro
4. Pageviews
Pageviews count how many times pages on your site are loaded, including repeat views.
Why it matters:
- This website traffic metric reveals your most visited content and landing pages, giving you valuable insights to sharpen your content strategy.
What to do if it’s high/low: If a few articles or category pages get most of the attention, build related pieces, add internal links, and place strong calls to action on those pages to move people deeper into your funnel.
5. Average session duration
Average session duration measures how long visitors stay on your site in a typical visit.
Why it matters:
- Longer sessions usually mean people read, click, and explore rather than bounce.
What to do if it’s high/low: If your average visit lasts only a few seconds, your messaging, targeting, or page layout may not match what visitors expect. When duration is low, review top landing pages for clarity, loading issues, and how quickly you show value.
6. Time on page
Time on page focuses on a single page and shows how long visitors stay before moving on.
Why it matters:
- Use it to judge whether the page holds attention and supports the next step, especially on key blog posts and landing pages.
What to do if it’s high/low: If it is low on pages that should educate or convert, tighten the page, improve clarity, and make the next step obvious.
7. Scroll depth
Scroll depth measures how far visitors scroll down a page.
Why it matters:
- It tells you whether people reach key sections or drop off early.
What to do if it’s high/low: Pair it with time on page to see whether people read most of a post, stop after the hero section, or jump straight to pricing. If they drop off early, tighten the intro, add clearer subheadings, and use high-quality visuals, such as simple charts or diagrams.
8. Pages per session
Pages per session tells you how many pages an average visitor views before leaving your site.
Why it matters:
- A higher number often signals helpful internal links, a clear structure, and content that piques people’s curiosity.
What to do if it’s high/low: If visitors see only one or two pages, add related links, better navigation, and end-of-page prompts that guide them to the next step that makes sense.
9. Bounce rate
Bounce rate is the percentage of visits in which someone lands on a page and leaves without clicking anything else.
Why it matters:
- Context matters because a high bounce rate on a quick reference page might be fine, while the same rate on a campaign landing page is a red flag.
What to do if it’s high/low: When bounce is high on pages that should convert, check message match with your ads, page speed, mobile layout, and whether you ask for too much information too soon.
10. New vs. returning visitors
New vs. returning visitors separates people who come for the first time from those who already know you.
Why it matters:
- A healthy mix means you keep attracting new audiences while staying relevant for existing ones.
What to do if it’s high/low: If most visitors are new, you may need stronger reasons to bring them back, like email capture, retargeting, or a clearer “next step” on key pages. If most visitors are returning, your reach may be too limited; expand acquisition through SEO content, partnerships, and new campaigns.
11. Exit rate and top exit pages
Exit rate and top exit pages show where visitors most often leave your site after seeing more than one page.
Why it matters:
- High exit rates on checkout steps, pricing pages, or onboarding content indicate friction.
What to do if it’s high/low: When a page underperforms, check the message, forms, trust signals, and page speed, then run small, focused tests to pinpoint what actually improves results.
12. Conversion rate
Conversion rate measures the share of visitors who complete a desired action such as a purchase, free trial, newsletter signup, or demo request.
Why it matters:
- It helps to separate macro conversions (orders, subscriptions, demo requests) from micro conversions (add to cart, video plays, email clicks) so you can debug each step of the funnel.
- Track this for key flows such as ecommerce checkouts, lead forms, and onboarding steps.
What to do if it’s high/low: When the conversion rate is low, focus on offer clarity, social proof, and friction points, such as long forms or hidden fees.
13. Goal completions
Goal completions count how many times people complete the desired action over a given period. With proper goal tracking in place, this metric becomes one of the most reliable indicators of whether your site is actually working.
Why it matters:
- This is your baseline volume, making it easy to track progress against monthly or quarterly targets through consistent goal tracking.
- When traffic is high, even a small lift in conversion rate can drive a big jump in goal completions, especially for ecommerce metrics like cart and checkout completions.
What to do if it’s high/low: If goal completions drop while traffic rises, treat it as a funnel issue and review each step from the entry page to conversion to find where users are dropping off.
14. Conversion path
Conversion path analysis shows the sequence of pages or events that visitors touch before they convert.
Why it matters:
- It answers which blog posts, feature pages, or campaigns quietly assist conversions, even if they are not the final step.
- For clean conversion paths, you need consistent lead-source tracking with accurate campaign tags.
What to do if it’s high/low: Use this insight to support content that often appears before a conversion and to remove steps that add clicks without adding value. For teams that need clearer revenue visibility, Usermaven works as performance attribution software that connects pages, campaigns, lead sources, and conversion paths, so you can see what actually contributes to growth.
15. Top pages for conversion
Top pages for conversion highlight the pages that bring in the most leads or sales, not just the most visits.
Why it matters:
- A product comparison page or pricing page might drive fewer sessions but a far higher share of revenue than a popular blog post.
What to do if it’s high/low: Once you’ve found your highest-impact pages, keep them fast, easy to understand, and focused on one clear next step. Then reuse their structure and messaging as the blueprint when you improve lower-performing parts of the site.
16. Keyword rankings
Keyword rankings show where your pages appear in search results for the terms you’re targeting.
Why it matters:
- High rankings for terms with strong buying intent drive consistent, qualified traffic without paid ad spend, making them a cornerstone of any web analytics dashboard.
What to do if it’s high/low: If rankings slip, refresh your content, strengthen internal links, and identify new questions your audience is asking. Focus on a core set of high-value terms rather than tracking every minor phrase, and organize them by search intent: informational, comparison, or transactional.
17. Organic traffic
Organic traffic refers to visitors who arrive through unpaid search results on engines such as Google.
Why it matters:
- A rising organic trend usually means search engines trust your site and people find your content useful enough to click.
- For many teams, organic traffic is one of the key website metrics that directly supports long-term growth.
What to do if it’s high/low: When organic traffic falls, review recent technical changes, content quality, and how your competitors position similar topics.
18. Click-through rate
Click-through rate (CTR) measures how many people click your result after seeing it on a search results page.
Why it matters:
- Low CTR usually means your title or description isn’t matching what people expect, even when your ranking is strong.
What to do if it’s high/low: Improve CTR with clear, benefit-led titles, accurate descriptions, and simple calls to action that reflect what the page actually delivers.
19. Site search
Site search covers what visitors look for using the search bar on your own site.
Why it matters:
- It reveals content gaps, navigation issues, and new product or feature ideas straight from your audience.
- This metric belongs in every website metrics report and supports your SEO KPIs because it shows the exact words visitors use.
What to do if it’s high/low: If many people search for terms you do not cover, add pages or help docs that answer those requests.
20. Page load speed
Page load speed measures how quickly a page loads and becomes usable for visitors.
Why it matters:
- Faster pages keep more people engaged, boost conversions, and improve search visibility, strengthening both awareness and revenue.
What to do if it’s high/low: If speed lags, compress images, remove or defer heavy scripts, enable caching, and reduce redirects. Check your most important templates like product pages, pricing, and sign-up flows on both mobile and desktop.
21. Traffic by device type
Traffic by device type separates desktop, mobile, and tablet visitors so you can see how people actually browse your site.
Why it matters:
- If most visits come from mobile but performance lags, it drags down every metric across your entire website.
What to do if it’s high/low: Compare engagement and conversions by device, then prioritize mobile fixes such as speed improvements, simpler layouts, and shorter forms if phone visitors trail behind.
How Usermaven centralizes all your website metrics in one place
Usermaven is an AI-powered analytics and attribution platform that gives you a complete, high-definition view of your traffic. Its website analytics dashboard brings all your key metrics into one shared view, making it easy for teams to monitor performance without jumping between tools.
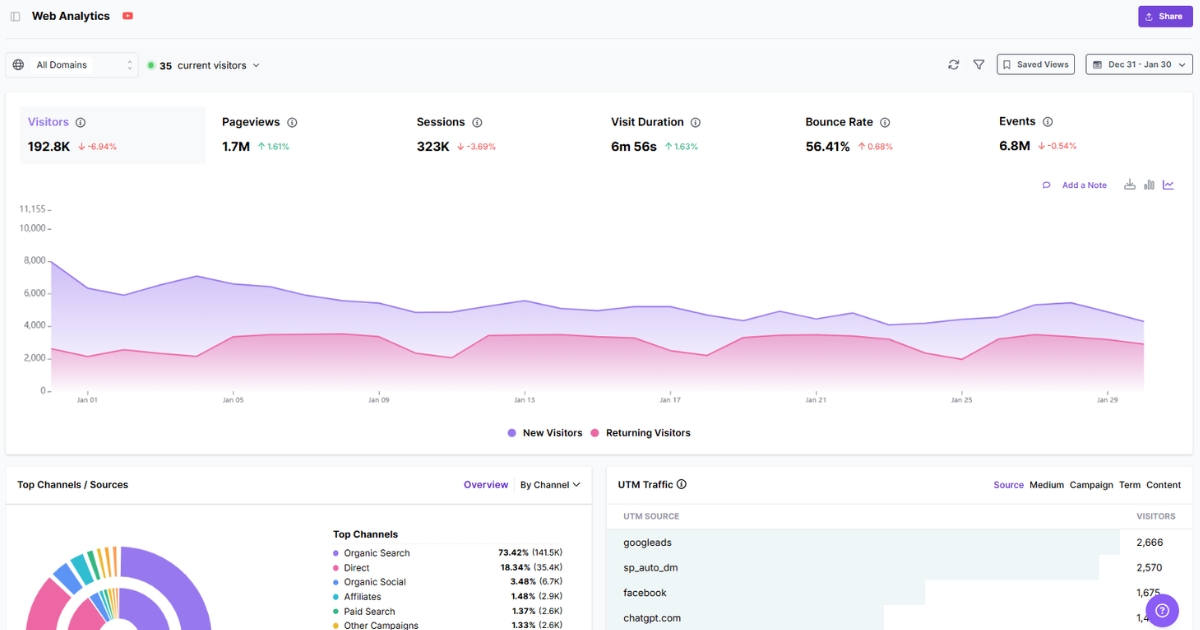
The platform eliminates data silos by combining traffic sources with in-app behavior, simplifying tracking website visitors while delivering AI-driven insights that untangle your most complex growth patterns.
- Unified tracking combines website analytics and product usage data into a single view for a complete picture of the customer lifecycle.
- Automatic event tracking captures every click, form submission, and interaction from day one without requiring a single line of developer code.
- Funnels show exactly where users drop off, allowing you to optimize every step from the first visit to the final sign-up.
- Detailed user journey maps outline every touchpoint a visitor encounters, revealing the specific paths that lead to high-value conversions.
- Real-time dashboards provide instant visibility into common web analytics metrics, such as traffic sources, page views, and active session counts.
- Multi-touch attribution identifies the specific marketing sources and campaigns that contribute most to your customer acquisition.
- No-code setup lets you go live in minutes, making it easy for non-technical teams to start tracking right away.
Wrapping up
Website metrics tell you if your site is doing its job. They show what’s driving conversions and what’s quietly killing them.
Usermaven works as marketing attribution software that also brings website metrics, channel performance, conversion paths, and drop-off insights into one clear view. You can see the full journey from first visit to conversion, understand which pages and channels are pulling their weight, and spot the gaps that need fixing.
Don’t let your growth go unmeasured. Start a free trial or book a demo with Usermaven today to see the true story behind your website metrics.
Leave a Reply