Most teams don’t struggle to build features. They struggle to know which ones matter.
That’s what product usage analytics is for. It turns real behavior into a clear signal: what users do on day one, what they repeat on day ten, and what never gets touched at all.
Once you have that, your product metrics stop being a debate.
They become a simple way to spot product adoption, identify friction, and double down on the behaviors that drive retention.
In this guide, we’ll break down what product usage analytics is, what to measure, and how to translate product usage data into clear next steps.
What is product usage analytics?
Product usage analytics is the practice of measuring how people actually use your product after they sign up.
Not just whether they logged in, but what they did next, what they repeated, and what they never touched.
The value is simple. You can stop guessing and start answering questions that improve long-term usage:
- Which actions happen before a user becomes “sticky”?
- Where do new users get stuck between signing up and their first value?
- Which features are adopted quickly, and which ones need better onboarding?
- Which usage patterns indicate churn risk before customers cancel?
Product analytics vs. product usage analytics
These two get used interchangeably, but they’re not always the same thing.
- Product analytics is the broad category. It covers the full picture of product performance, including acquisition, user activation, retention, experiments, and monetization.
- Product usage analytics is narrower and more tactical. It focuses on what people do after they’re in the product.
If you’re building a full product analytics setup, our guide to the best product analytics tools can help you choose the right platform.
Why traditional analytics falls short for product usage analysis
Most teams can track activity with traditional analytics. Pageviews, clicks, feature usage, and even a basic adoption chart.
The problem shows up the moment you try to connect that activity to outcomes like revenue, expansion, churn risk, or lifetime value. That usually requires stitching product behavior to customer context, and that’s where the stack starts to creak.
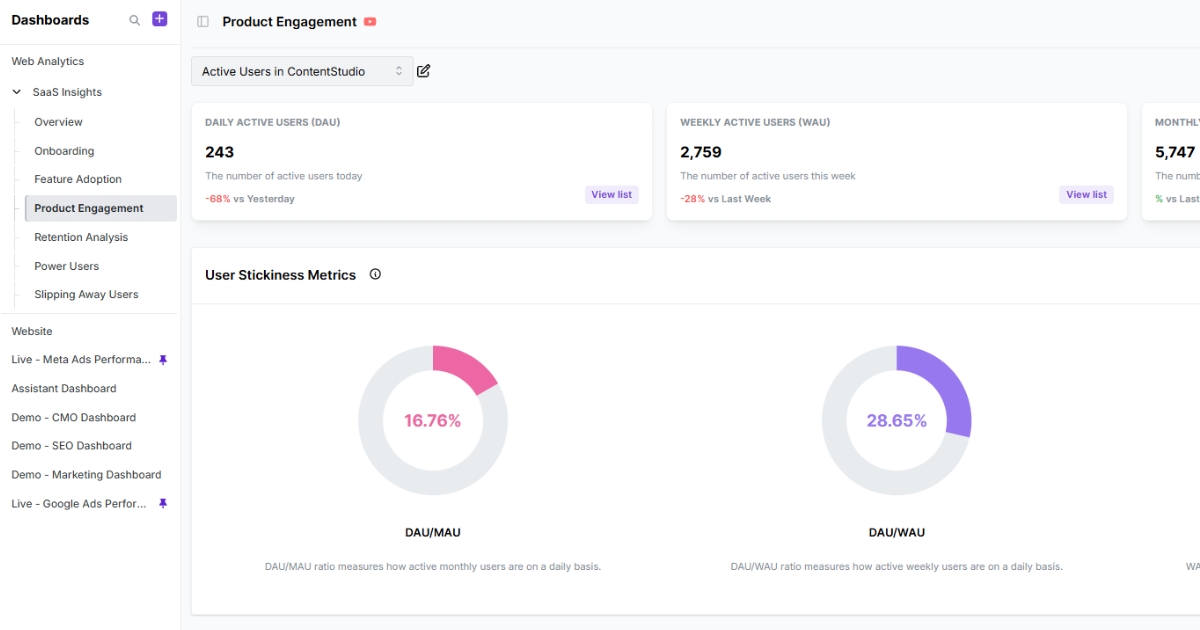
Most teams end up with product behavior in one place and customer context somewhere else (billing, CRM, support, warehouse). When those pieces don’t connect seamlessly, you get predictable problems:
- Marketing attribution stays incomplete. Without SaaS attribution software connected to product usage data, you can spot that certain onboarding steps improve retention, but you can’t reliably trace which acquisition sources bring users most likely to complete them.
- Signals turn misleading without context. Usage declines look like churn, but you miss what happened first, like repeated support tickets, access issues, or account changes.
- Teams waste time stitching systems together. Instead of running product usage analysis, you’re building pipelines, arguing over definitions, and patching holes in tracking.
- The metrics you need are locked away. Revenue, CLV, and other core business indicators often can’t be analyzed alongside usage because they never leave the warehouse.
How product usage analytics differs from marketing analytics and BI
These three can look similar on the surface, but they answer different questions.
Here’s a quick table that shows what each one is actually built to do.
| Type | What it measures | Best for | Typical outputs |
| Product usage analytics | In-product actions and flows | Adoption, onboarding, retention | Funnel analysis, paths, cohorts, feature usage |
| Marketing analytics | Channel and campaign performance | Acquisition efficiency, conversion | Attribution, CAC/ROI, channel reports |
| BI (Business Intelligence) | Business results across systems | Revenue and churn analysis, forecasting | KPI dashboards, segment trends, forecasts |
💡 If you want a deeper walkthrough of how product and marketing analytics overlap, check out our guide on product vs. marketing analytics.
Product usage metrics to track
To turn raw data into real decisions, you need to focus on the signals that show how users actually use your features. Here are the core metrics to track:
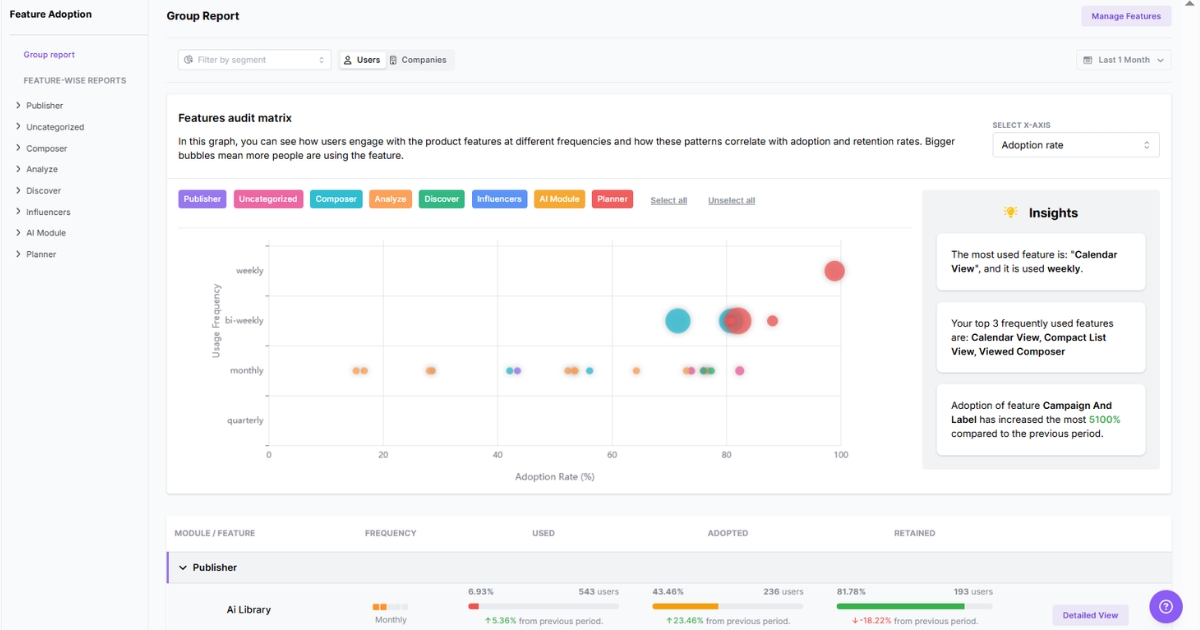
- Active users (DAU/WAU/MAU): Your baseline for product usage. Track the trend, then break it down by segment (plan, role, channel) so it’s actually actionable.
- Stickiness (DAU/MAU or WAU/MAU): How often “monthly users” show up. A quick read on whether your product is becoming routine.
- Activation rate: The share of new users who reach your first real value moment, often the aha moment where the product finally clicks (not just “signed up”).
- Drop-off rate in key flows: Where users abandon important workflows (invite teammates → create first project → first output). This is where friction hides.
- Feature adoption rate: Percent of active users who use a feature at least once in a set period. Great for seeing what’s actually getting discovered.
- Feature engagement depth: This distinguishes “tested it once” users from those who have made a feature part of their daily workflow. High depth is a key indicator of power users.
- Time to value (TTV): How long it takes a user to reach that first value moment. Shorter TTV is often the most direct path to boosting product engagement early in the lifecycle.
- Path completion rate: How many users follow your intended “happy path” from entry to outcome, and where they detour or stall.
- Cohort retention: Whether users return week over week or month over month. Cohort analysis makes it easier to determine if changes actually improved repeat usage.
- Churn rate: The percentage of users or accounts that stop using the product. Define it clearly (canceled, downgraded, or inactive for X days) so it’s measurable.
[product_analytics]
Benefits of product usage analytics
Let’s look at what product usage analytics actually helps with.
Make data-driven product development decisions
When teams lack clear usage data, prioritization becomes opinions, loud requests, and internal hunches.
Product usage analytics replaces that with proof. You can see what gets used repeatedly, what gets ignored, and what workflows are actually tied to long-term engagement. That makes product development roadmaps easier to defend and easier to adjust when reality changes.
Uncover friction in the product experience
Users rarely tell you when something feels confusing. They just take a different path, stall, or stop showing up.
Usage data makes those friction points visible. It shows where drop-offs occur in key flows and where users abandon a feature after the first attempt, so fixes are targeted rather than vague “UX improvements.”
Improve product stickiness with repeatable habits
Product stickiness isn’t about more activity. It’s about the repeat value.
Product usage analytics helps identify the behaviors that retained users repeat and the sequences that precede long-term engagement. Once those are clear, onboarding and in-product guidance can encourage more users to adopt the same habits.
Make product-led growth measurable
Product-led growth only works when users can reach value on their own and keep finding reasons to come back.
Product usage analytics provides the measurement layer for that: activation paths, TTV, and the actions that tend to precede upgrades or expansions. That turns PLG from a product analytics strategy into something you can monitor and improve.
Quick note: If you’re weighing PLG against a sales-led motion, our product-led vs. sales-led growth guide lays it out clearly.
Segment users based on how they actually behave
Different roles and customer types don’t use the product the same way. Usage analytics makes that obvious.
Segmenting by plan, role, company size, or lifecycle stage helps you see which groups struggle, which thrive, and what “success” looks like for each group. That leads to a more relevant product experience without turning every user into a one-off case.
Connect product behavior to business outcomes
Feature adoption is useful, but it’s rarely the end goal.
The real value lies in tying usage patterns to outcomes such as customer stickiness, expansion, and churn analysis. When product behavior is connected to those business metrics, it becomes easier to invest in the right improvements and stop shipping changes that only move surface numbers.
A practical framework for implementing product usage analytics
You can’t implement product usage analytics on “effort” alone. The setup only sticks when the tooling is easy to maintain, and the data is easy to trust.
Step 1: Choose a tool your team will actually use
Before you track anything, pick a setup that matches how your team works. The right tool makes tracking easy to implement, reporting easy to use, and insights easy to trust.
A quick checklist:
- Fast setup without weeks of manual tagging
- Built-in insights like funnels, paths, cohorts, and trends
- Self-serve reporting for PMs and growth teams
- Clean definitions and governance so metrics don’t drift
Step 2: Set one clear goal and define the value moment
Pick a single outcome to improve: activation, adoption, or expansion. Then define the first value moment that proves a user has actually experienced the product.
Without those two anchors, tracking quickly turns into a long list of events that don’t feed into your product usage reports.
Step 3: Choose a small set of metrics that earn their place
Pick the few metrics that will tell you, quickly, whether you’re moving toward the goal. Leave out vanity metrics that look good in a report but don’t change a decision.
A simple test: if this metric goes up or down, do you know what you’d check next or what you’d do differently? If not, it doesn’t belong in the core set.
Step 4: Define the events and context you need to track
Metrics come from events. Define the handful of actions that represent real progress, then add the minimum context required to make the analysis meaningful.
That usually includes:
- Key events (progress actions, not every click)
- Properties (plan, role, account size, feature name)
- User and account identity
Step 5: Build one core view for weekly review
Before you build a library of product analytics dashboards, create a single view that the team checks regularly.
It should answer:
- Are users reaching value?
- Where are the biggest drop-offs?
- What features are being adopted and reused?
- What changed after the last release?
Consistency beats complexity.
Step 6: Analyze usage patterns and turn them into clear decisions
Start by reading the data like a product story. What’s improving, what’s slipping, and where users drop off in key flows.
Then validate what you’re seeing with a few focused analysis moves:
- Segment results by plan, role, lifecycle stage, or acquisition channel to find where the trend is really coming from.
- Compare cohorts to isolate what changed after a release, onboarding update, or pricing shift.
- Review paths to see what successful users do next, and where churn-risk users stall.
Product usage analytics tools
Product usage analytics software varies widely. Some are built for event-based product insights, others lean into UX behavior, and a few sit closer to BI.
Here are 10 tools to consider:
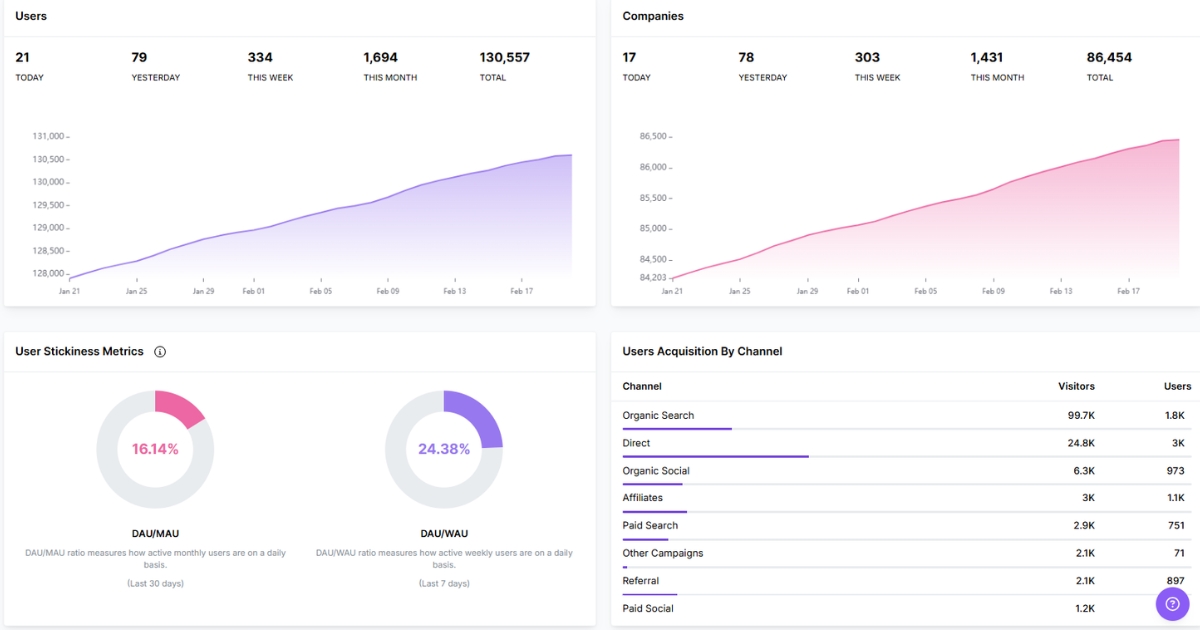
- Usermaven: Product analytics + attribution with quick setup and clean reporting for tracking adoption, drop-offs, and retention.
2. Amplitude: Advanced product analytics with strong segmentation, cohorts, and lifecycle reporting.
3. Mixpanel: Event-driven reporting for funnels and usage trends.
4. Heap: Auto-capture analytics that reduce upfront tracking work.
5. Pendo: Product analytics paired with in-app guides and feedback collection.
6. PostHog: Open-source product analytics with event capture and experimentation support.
7. FullStory: Session replay and experience insights for diagnosing friction and UX issues.
8. Hotjar: Heatmaps and recordings to understand what users do, and where they hesitate.
9. GA4: Web analytics with event tracking for product and site journeys.
10. Looker: BI layer for modeling and exploring product usage data in a warehouse.
Wrapping up
Product usage analytics keeps product decisions grounded. It shows the actions that lead to value, and the steps where users lose momentum.
The real advantage comes when usage isn’t isolated from the rest of the journey. Usermaven connects how people arrive with what they do once they’re in. As a powerful website analytics tool, it helps you see which behaviors actually lead to upgrades and long-term customers, without stitching reports across multiple tools.
Want a clearer view of product usage that you can act on this week? Start a free trial or book a demo and see what you can do with Usermaven.
Leave a Reply